Table of Contents
Data modeling techniques for more modularity
Editor's note: This post blends Randy’s commentary on data modeling with practical examples from Christine’s Coalesce 2020 talk on auditing your DAG.
Back when I started working in the data industry, as part of recruitment you’d get this Army-style pamphlet about all the cool stuff you’re going to do. Then you sit down at your desk, and things get messy.
For actual decades, maintaining a productive and reliable data pipeline was an unexciting daily grind of putting out the same fires month after month, restricting access to only the “trusted” builders and watching sadly as those builders moved on to other opportunities and left you with a mess of code that no one truly understands. This is not a fun place to be.
With cloud data warehouses and tools like dbt, this reality has changed. While the world is filled with fun things that are terrible for you - like french fries, soda, and fireworks - dbt and the practice of Analytics engineering allow for the rare situation where doing fun thing is also doing the right thing.
A large part of this shift is moving from massive, thousand+ line sql scripts and intimidating t-sql procedural nightmares to modular, accessible, and version-controlled data transformation. Work is divided into cleanly separated concerns:
- procure raw source data
- prepare them as needed in staging models
- present them to the end consumer in fact + dimension models and in data marts
As analytics engineers, how we prep data for analysis makes all the difference in how trustworthy it is to the rest of our organization. If your end users don’t trust the data, it does not matter how much work you put in to all the previous steps - they will still silo their work in excel sheets and bury important business logic in one off dashboard filters.
A few questions can help keep data modeling efforts on the right track:
- Are models consistently defined and named? Can someone immediately grok what a given data model does?
- Are models easily readable? Are your individual models DRY enough to be quickly interpretable?
- Are models straightforward to debug + optimize? Can anyone identify a modelneck (a long-running model) and fix it?
We’ll dig into those three later on, but first, let’s take a step back to the “before times” of non-modular data modeling techniques.
Traditional, monolithic data modeling techniques #
Before dbt was released, the most reliable way that I had to model data was SQL scripting.
This often looked like writing one 10,000 line SQL file, or if you want to get fancy, you could split that file into a bunch of separate SQL files or stored procedures that are run in order with a Python script.
Very few people in the org would be aware of my scripts, so that even if someone else was looking to model data in a similar way, they’d start from source data rather than leveraging what I’d already built. Not that I didn’t want to share! There just wasn’t an easy way to do so.
We could call this a monolithic or traditional approach to data modeling: each consumer of data would rebuild their own data transformations from raw source data. Visualizing our data model dependencies as a DAG (a directed acyclic graph), we see a lot of overlapping use of source data:

What is modular data modeling? #
With a modular approach, every producer or consumer of data models in an organization could start from the foundational data modeling work that others have done before them, rather than starting from source data every time.
When I started using dbt as a data modeling framework, I began to think of data models as components rather than a monolithic whole:
What transformations were shared across data models, that I could extract into foundational models and reference in multiple places?
Note: in dbt, one data model can reference another using the ref function.
When we reference foundational data models in multiple places, rather than starting from scratch every time, our DAG becomes much easier to follow:
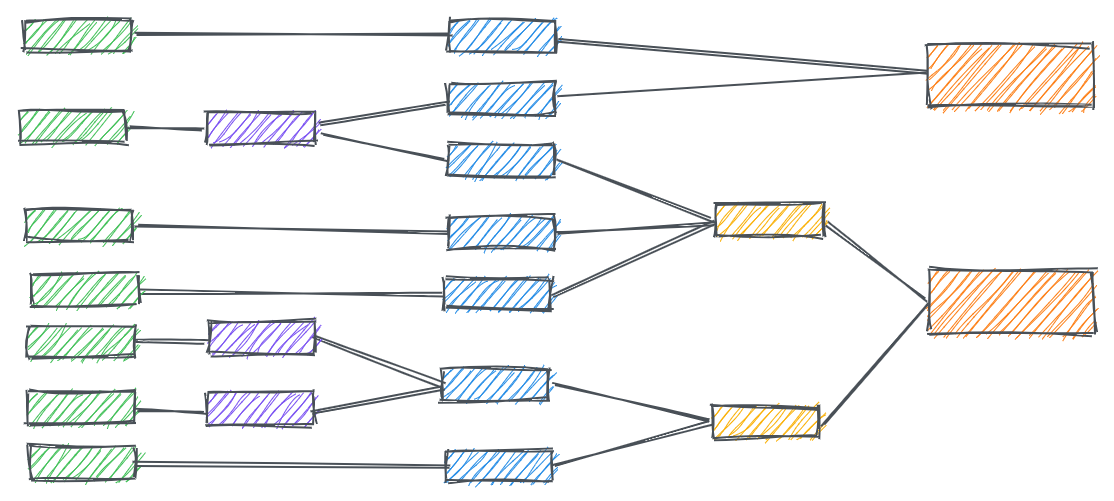
We see clearly how layers of data modeling logic stack upon each other, and where our dependencies lie.
It’s important to note that just using a framework like dbt for data modeling doesn’t guarantee that you’ll produce modular data models and an easy-to-interpret DAG.
Your DAG, however you construct it, ultimately is just a reflection of your team’s data modeling ideas and thought processes, and the consistency with which you express them.
Let’s get into those 3 tenets of modular data modeling: naming conventions, readability, and ease of debugging + optimization.
Data model naming conventions #
A dbt project, at its core, is just a folder structure for organizing your individual SQL models. Within the /models/ folder of a project, any .sql files you publish will be materialized as tables or views to your data warehouse - so you can either make them easy for your team to navigate, or a complete pain - the choice is yours!
Without a solid naming convention, our team may end up rebuilding models that had already been reviewed and published, or rejoining data in duplicative + low-performance ways. You could say that a naming convention brings a zero-waste policy to our salad bar, and locks in model reusability.
Note: Even with an established naming convention, we need an equally solid data model peer review process, to ensure that it gets followed with each new addition to our transformation logic.
Our data model naming convention defines two things about each of our model layers:
- The types of models we’ll use (source, staging, marts etc)
- What types of transformation each of those models types is responsible for
My career hit the data space right when cloud warehouses like Databricks, BigQuery, Snowflake et al. were first being adopted - I’ve had the luxury of never worrying too much about compute + storage cost.
So when I think about data modeling techniques, I don’t really think in terms of style (Kimball, Data Vault, star schema, etc), although plenty of people find those techniques to be useful.
Instead, I generally follow our internal modeling conventions at dbt Labs, which focuses on finding the shortest path between raw source data and the data products that would actually solve a problem for them.
Of course your conventions may differ! The important thing is just to have a convention and stick to it.
Staging models
The purpose of staging models (in our convention) is just to clean up and standardize the raw data coming from the warehouse, so we have consistency when we use them in downstream models.
In our dbt project, we’ll place them in a staging folder, and prefix filenames with stg_ for easy identification (so our Zendesk chat log would be stg_zendesk_chats, which is based on the raw zendesk.chats source table).

They’re typically a one-to-one reflection of each of our raw sources, and we do really light transformations at the staging layer. We will very rarely join data models at the staging layer, but instead will perform transformations like:
- Field type casting (from FLOAT to INT, STRING to INT, etc), to get columns into the proper type for downstream joins or reporting
- Renaming columns for readability
- Filtering out deleted or extraneous records
Doing these types of base transformations at the staging layer (and the staging layer only) serves as a jumping-off point for our heavier transformation layers downstream.
If anything ever changes in the source data, we have a layer of defense, and can be confident that if we fix the staging layer, our changes will flow into downstream models without manual intervention.
Data mart models
The data mart layer is where we start applying business logic, and as a result, data mart models typically have heavier transformations than in staging. The purpose of these models is to build our business’s core data assets that will be used directly in downstream analysis.
In our marts project folder our models are generally dimension and fact tables, so we prefix them with dim_, or fct_.
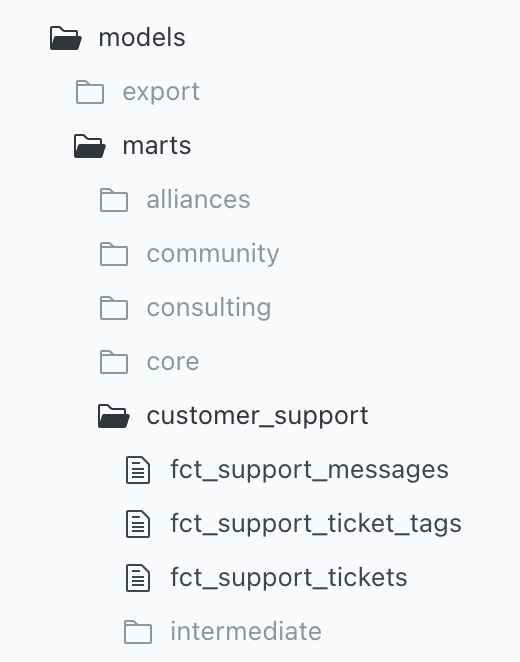
The common SQL transformations that you’ll see at the data mart layer are:
- Joins of multiple staging models
- CASE WHEN logic
- Window functions
Really nothing’s off limits at the mart layer - this is the space to get as complex as we need to.
Further model layers to explore (base, intermediate and beyond)
At a minimum, you should familiarize yourself with staging, dimension, and fact models. But you can always opt for more layers to better organize your data!
Two optional layers we commonly use are base and intermediate:
- Base models are prefixed with
base_and live in the staging folder alongsidestg_models. If a subset of staging models from the same source lack utility on their own, it may make sense to join them together in a base model before moving downstream. - Intermediate models are prefixed with
int_and live within the marts folder. If your marts models are overly nested + complex to read, splitting some of the logic into one or more intermediate models will help with readability down the line.
These are two layers that we commonly use internally at dbt Labs, but feel free to make your own conventions! What’s important is that you make a convention for data model layer naming and follow it, but the specifics will vary widely.
A modular data modeling example #
Let’s go back to our salad bar example, and go through each layer from the ground up.
Source + staging models: the raw ingredients
We’ll start with our raw ingredients: the raw data that just exists in my data warehouse. Maybe it made it there via an ETL tool or a custom script, but we’ve got raw data flowing.
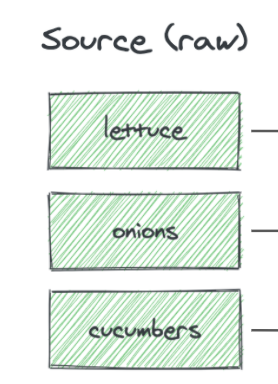
We’ll refer to these as sources, and the first models I’m going to build are my staging models.
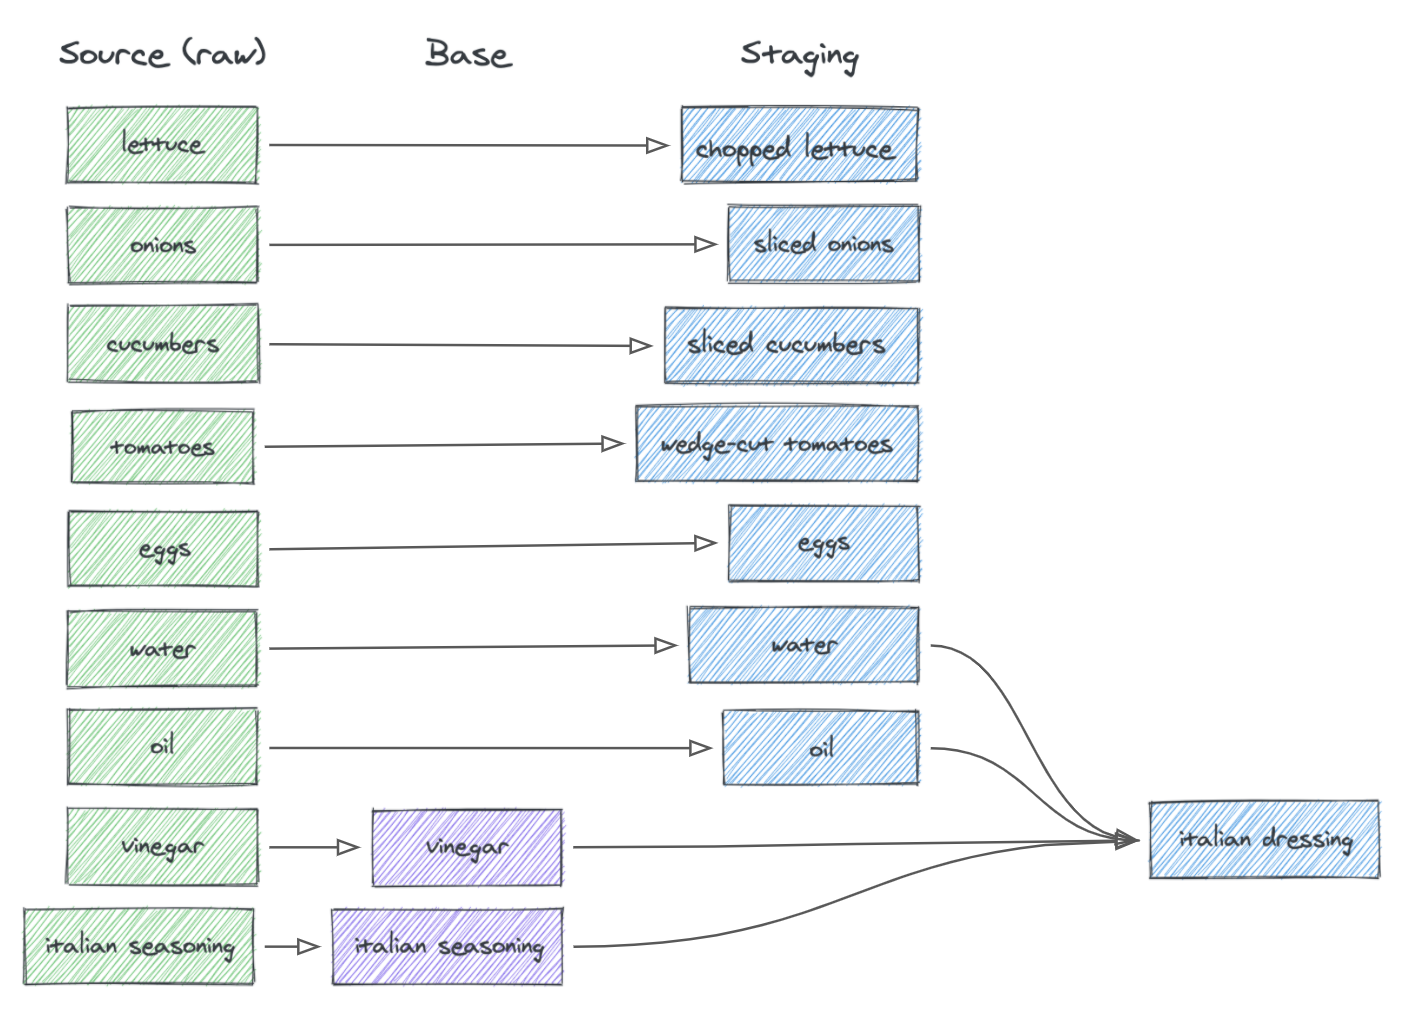
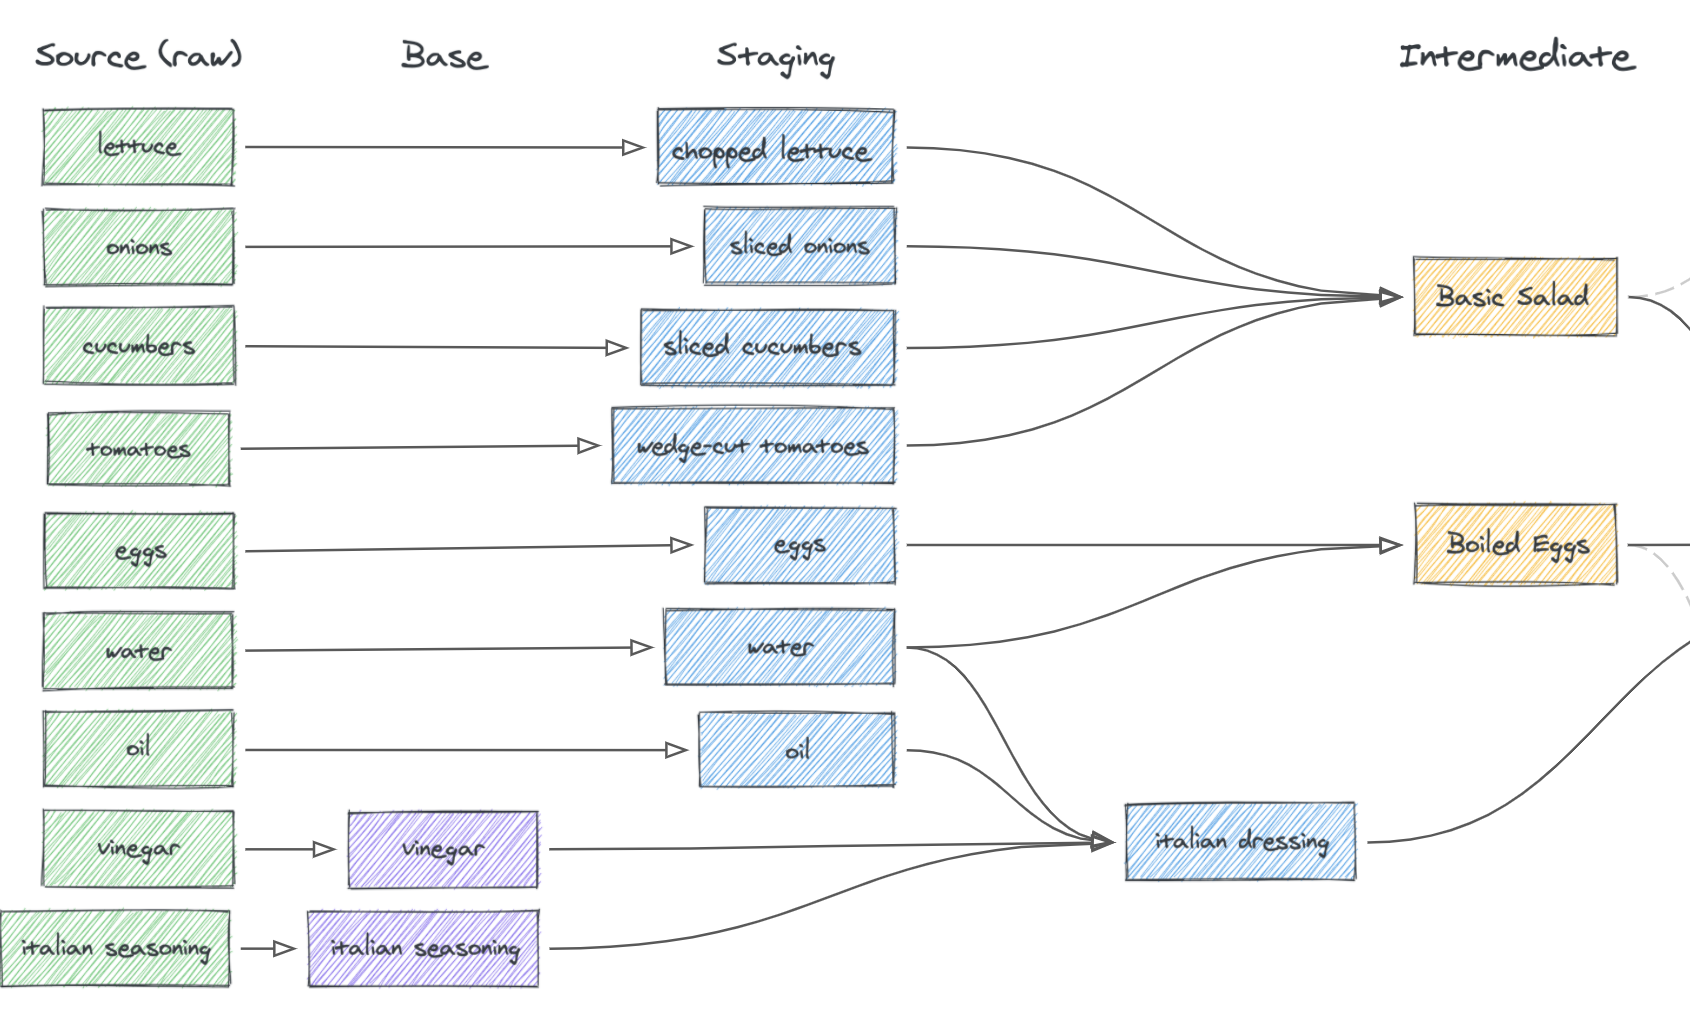
You can see I’m really just prepping each individual ingredient here. If you think of these things as being available on an assembly line, you can see it’ll be really easy to make a salad.
Take note of the Italian dressing. I haven’t prepped this yet - that’s because giving cleaned-up versions of the ingredients (vinegar, Italian seasoning, oil, and water) won’t be of much use to anyone on the assembly line. They would have to mix these ingredients every time to create Italian dressing.
We need to do something a little bit different with these ingredients - we need to make a join in the staging layer (!). It’s important to note that I want to produce the results of this join in the staging layer because of how my organization uses the ingredients - and that’s an important decision to consider. For the purposes of this demonstration, no one will use water, oil, vinegar, or Italian seasoning on their own.
In order to keep a 1:1 relationship with the raw ingredients (between raw sources and staging models), I’m going to implement a base layer (shown in purple).
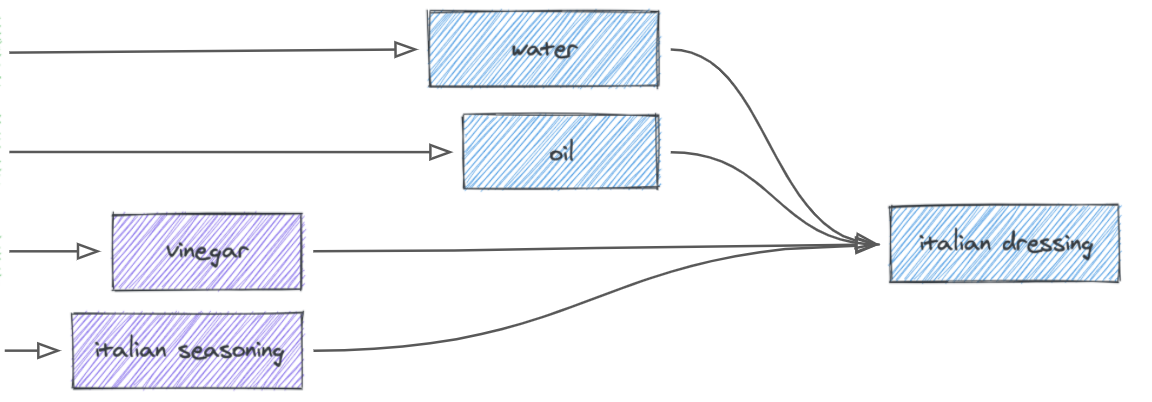
This layer takes over what staging usually does - the reason we provide this is because we always want to have a model which standardizes our data and provides that layer of defense, whether that becomes a base or staging model. Our downstream models will benefit from those transformations and we can start developing consistency in how our data is commonly used.
Layering in intermediate models: the basic components
Now let’s build the intermediate layer, where I’ll conduct some major data transformations.
Unlike base or staging models, this layer is completely optional, but it’s especially useful for creating reusable components or breaking up large transformations into more understandable pieces—in our case, those components would be a basic salad + boiled eggs.
Fact + dimension tables: the finished product
Finally, in order to complete the salad bar, I’m going to join in all of those steps to make our data marts, our fact + dimension tables.
A fact or dimension table brings together multiple components to present a unified whole—in our salad example, it’d bring together the basic salad greens, boiled eggs + italian dressing to form a ready-to-eat salad:
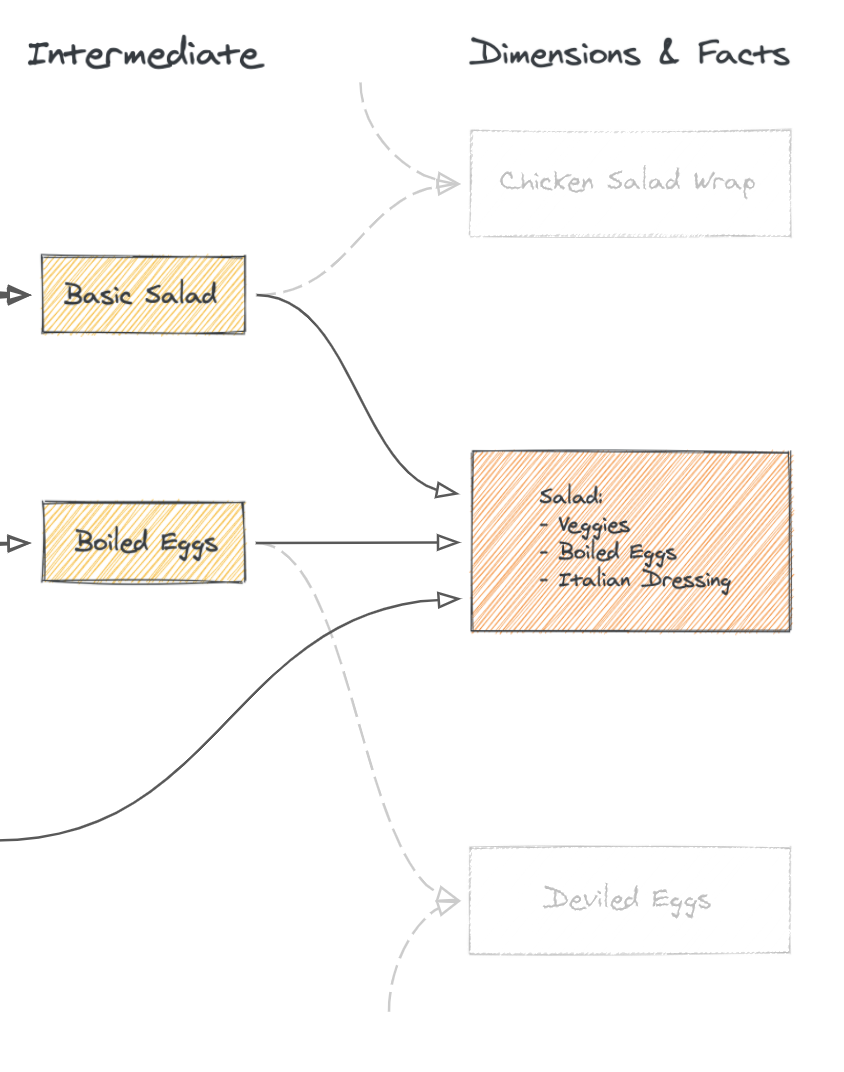
This is by no means the end of the data transformation road. A salad (or any individual dish) usually doesn’t make up an entire meal. In an analysis, we’ll usually pull together multiple dimension or fact tables to build a complete picture.
But! Every data user has different tastes, and may want to join data mart models in slightly different ways at the point of analysis—so we’ll generally want to leave that last mile of joining together facts + dimensions to the analysis tool itself when possible.
Where transformation stops and analysis begins
It’s really helpful to define where your data modeling effort ends, and where it’ll be picked up by the end user in an analysis tool (a BI dashboard, notebook, or data app builder).
You may end up writing SQL in both your data models and downstream tooling, but your decision for where certain transformations live comes down to the features of your tools and the technical knowledge of your end users (BI analysts, ML engineers, business users).
If your end user will be writing SQL to pull the data they need, or if they’re using an analysis tool that joins tables for them, then your final data modeling output can be generalized, standardized fact and dimension tables. They can then freely mix and match these to analyze various aspects of the business, without you needing to pre-model the answer to every question in your transformation project.
If your end users don’t write SQL or your analysis tooling is limited in terms of self-serve joining, then you’ll probably need to curate datasets which answer specific business questions, by joining together multiple fact and dimension tables into wide tables.
If that’s the case, we recommend adding an additional ‘report’ model type to your project, with a naming convention of report_ or rpt_.
In our data models in dbt, we’re aiming to bring data together and standardize much of the prep work that comes with making an analysis. We are not looking to pre-build in the data warehouse every analysis or complex aggregation that may come up in the future.
That’s a better job for downstream tooling, whether that’s at the BI layer, in ML models, operational workflows, or in a notebook app.
Sometimes you just can’t avoid pre-aggregating data within data models, and that’s ok. The important thing is just to define (in your model naming conventions + tooling use standards) a line where data mart construction ends and analysis begins.
Data model readability #
A solid naming convention will make our data modeling project as a whole easy to navigate. But what about our individual data models themselves, the .sql files that will actually be written to our warehouse?
I always strive to keep individual model files to roughly 100 lines of code for high readability. Generally data models shorter than 100 lines have avoided doing overly complex joining, either by limiting the raw number of joins, or by joining in simple ways (repeatedly on the same key).
That way, anytime someone on the team (or myself!) cracks open the data model, they can understand very quickly what it does and see how they might modify or extend it.
“OK, dim_intercom_chats joins together stg_intercom_chats with stg_customers to map a customer’s plan to their chat log.”
Problem is, SQL files can be long and tedious to read! If you’ve migrated between 3 different live chat platforms, you’ll have to UNION ALL on those 3 source tables to roll up your full live chat history.
If you’re building a date spine to calculate retention, that requires a lot of boilerplate SQL to generate a date spine.
That’s where the magic of dbt + Jinja macros comes in - they allow you to invoke modular blocks of SQL as macros from within your individual SQL files.
When I was doing data consulting, my client calls sounded like iPhone ads.
Need to standardize the way you build date spines? “There’s a macro for that.”
Need to model Snowplow events? “There’s a package for that.”
Need to calculate MRR? “There’s a playbook for that.”
If you want to be sprinting out data models quickly while keeping them easily readable by your team, you must leverage macros and packages built by those who have come before you. Eventually, you’ll learn how to build your own, and contribute back to that knowledge loop.
I end up writing macros for the things that I can’t natively do in SQL, and the things I hate doing in SQL.
Data model optimization and debugging #
The first time I tried building data models modularly with dbt, I wasn’t convinced it’d change anything for the better. I had committed to giving a talk on it - so there I was, working up a demo.
And then it broke. That’s where I actually started to get excited.

Because I’d built models modularly, one stacking on the next, dbt made it really clear to me why the pipeline of models was broken, and where to fix it. So I could go in, update the broken model, run it again — and everything downstream of that broken model picked up the fix.
That was my “a ha” moment with modular modeling — it was so much faster to debug + fix issues, which is what eats up so much of our time as data people.
Optimizing modelnecks
Sometimes your data models don’t flat-out break, they just slow down.
[ Blockquote: A modelneck, first coined by Jeremy Cohen in summer of 2021, is a long-running data model that slows the performance of your entire data transformation pipeline. ]
Working modularly and in an open source context like dbt, I always ended up having free hands on the team faster than I’d expected, because we’re doing less unnecessary work.
This frees up time for optimization after you’ve already delivered a proof of concept, because we haven’t been required by our stack to optimize on the front end.
So those free hands are going to dive into our DAG and look for bottlenecks in our data models. Again, the DAG is just a reflection of our internal thinking and process, so if we haven’t spent time optimizing for individual SQL model runtimes, it likely will present plenty of opportunities to us.
We’ll see a triple join there that’s taking forever, and create some surrogate keys on that to speed things up.
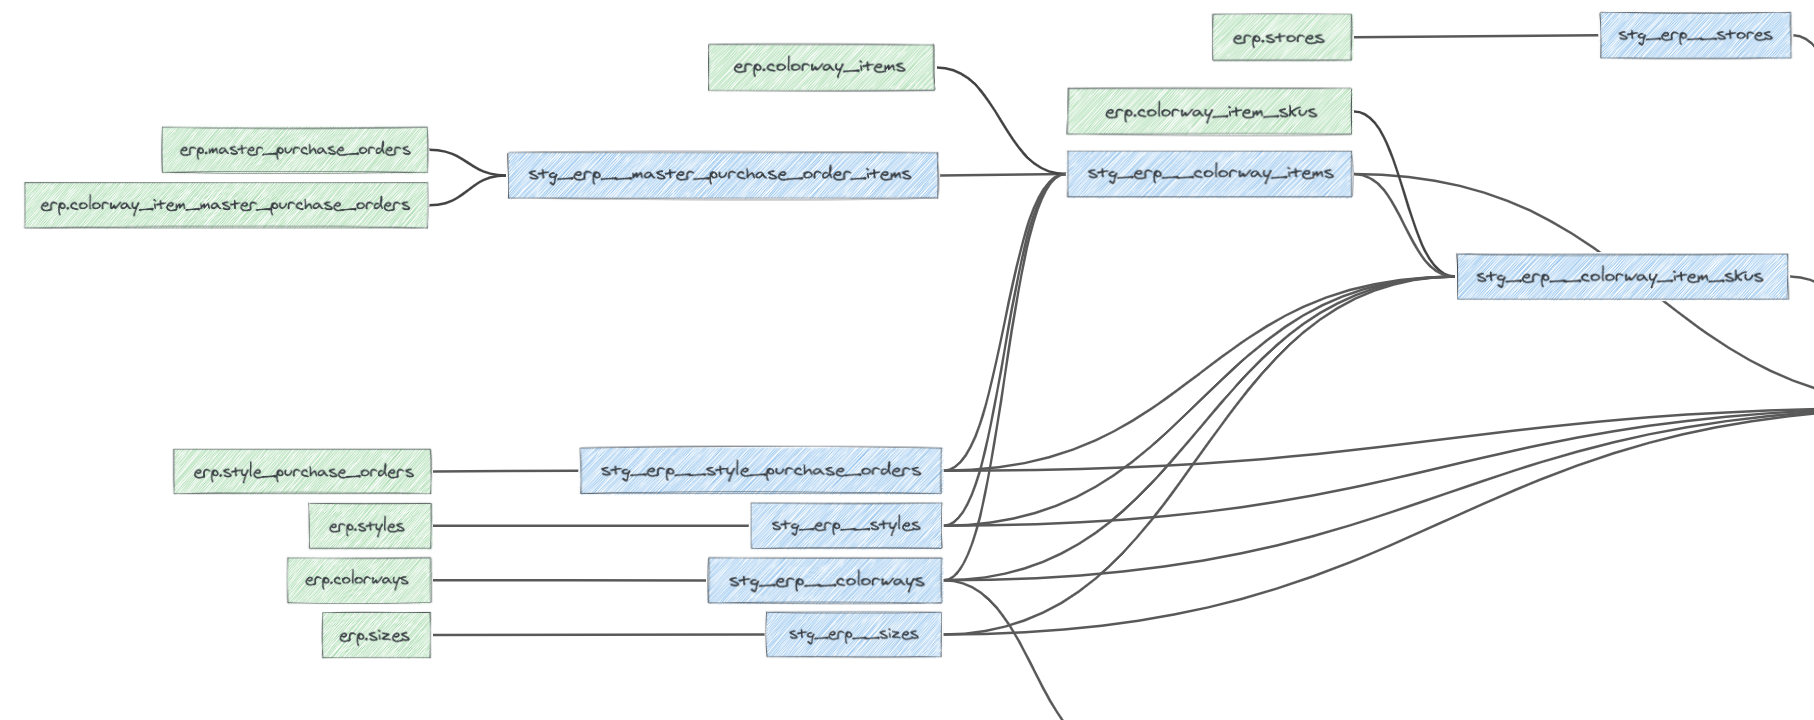
That modelneck can clearly become much more linear and modular:
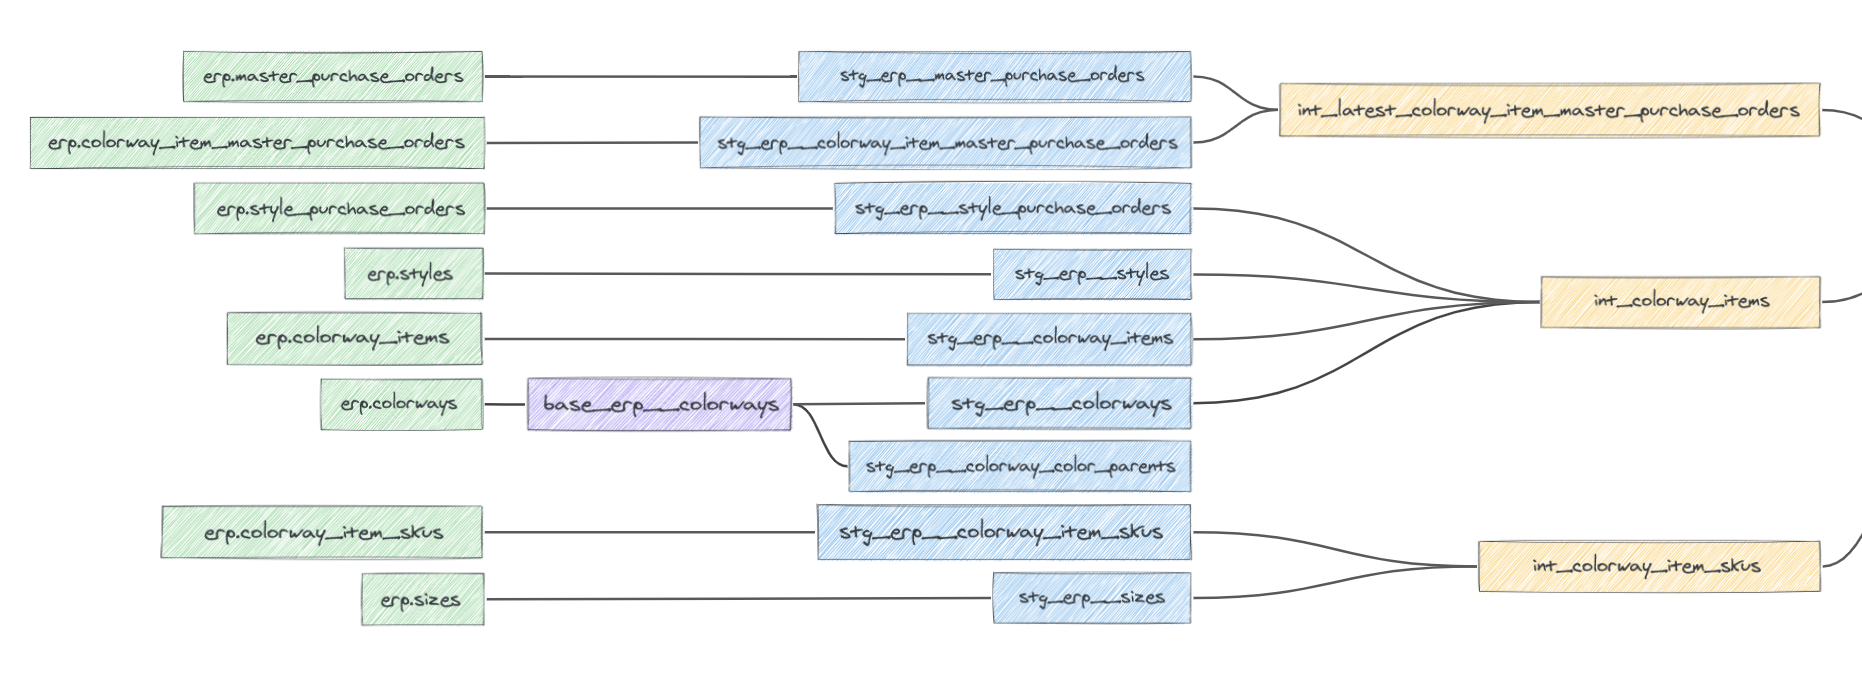
Those free hands are going to add incremental materializations to long-running models that don’t need a nuclear full-refresh on every run.
So only after shipping a rough version of the data product, we need to get into the nitty gritty of making it scalable for long-term cost. And since the entire data transformation DAG is transparently visible to the entire team, anyone can jump in and optimize these modelnecks.
Getting the team involved #
I’ve always been surprised at the high quality of SQL modeling that new contributors are able to do, once a project has a clearly defined structure to build on - in our example, once the initial salad bar is built, trusted and ready to eat from.
This is true regardless of “technical” ability of your team’s contributors - as long as you can write SQL, a solid folder structure + clear model review process are enough in terms of guardrails to keep transformation code quality high.
When I witness this process take place on teams adopting a modular data modeling approach, it’s like releasing a fish back into the water: they already know how to do it, if given the right environment.
So that I see as our collective work going forward — how do we allow more people to get their roll up their sleeves, start building data models, and making sense of their own data?
How do we continue to make this modular data modeling learning curve less of a rope ladder, and more like an escalator?
Last modified on: